
SUBSCRIBE to the Fact of the Week
Petroleum exports were rising in 2015 and petroleum imports held fairly steady at just over 9 million barrels per day, but the value of those imports and exports was significantly lower than the previous year. The falling cost of a barrel of oil in 2015 has caused the value of petroleum imports to be less than $200 billion (in constant 2015 dollars) for the first time since 2003. Exports grew 14% by volume from 2014 to 2015 while declining 31% by value in the same period.
Petroleum Trade by Volume and Value, 1975-2015
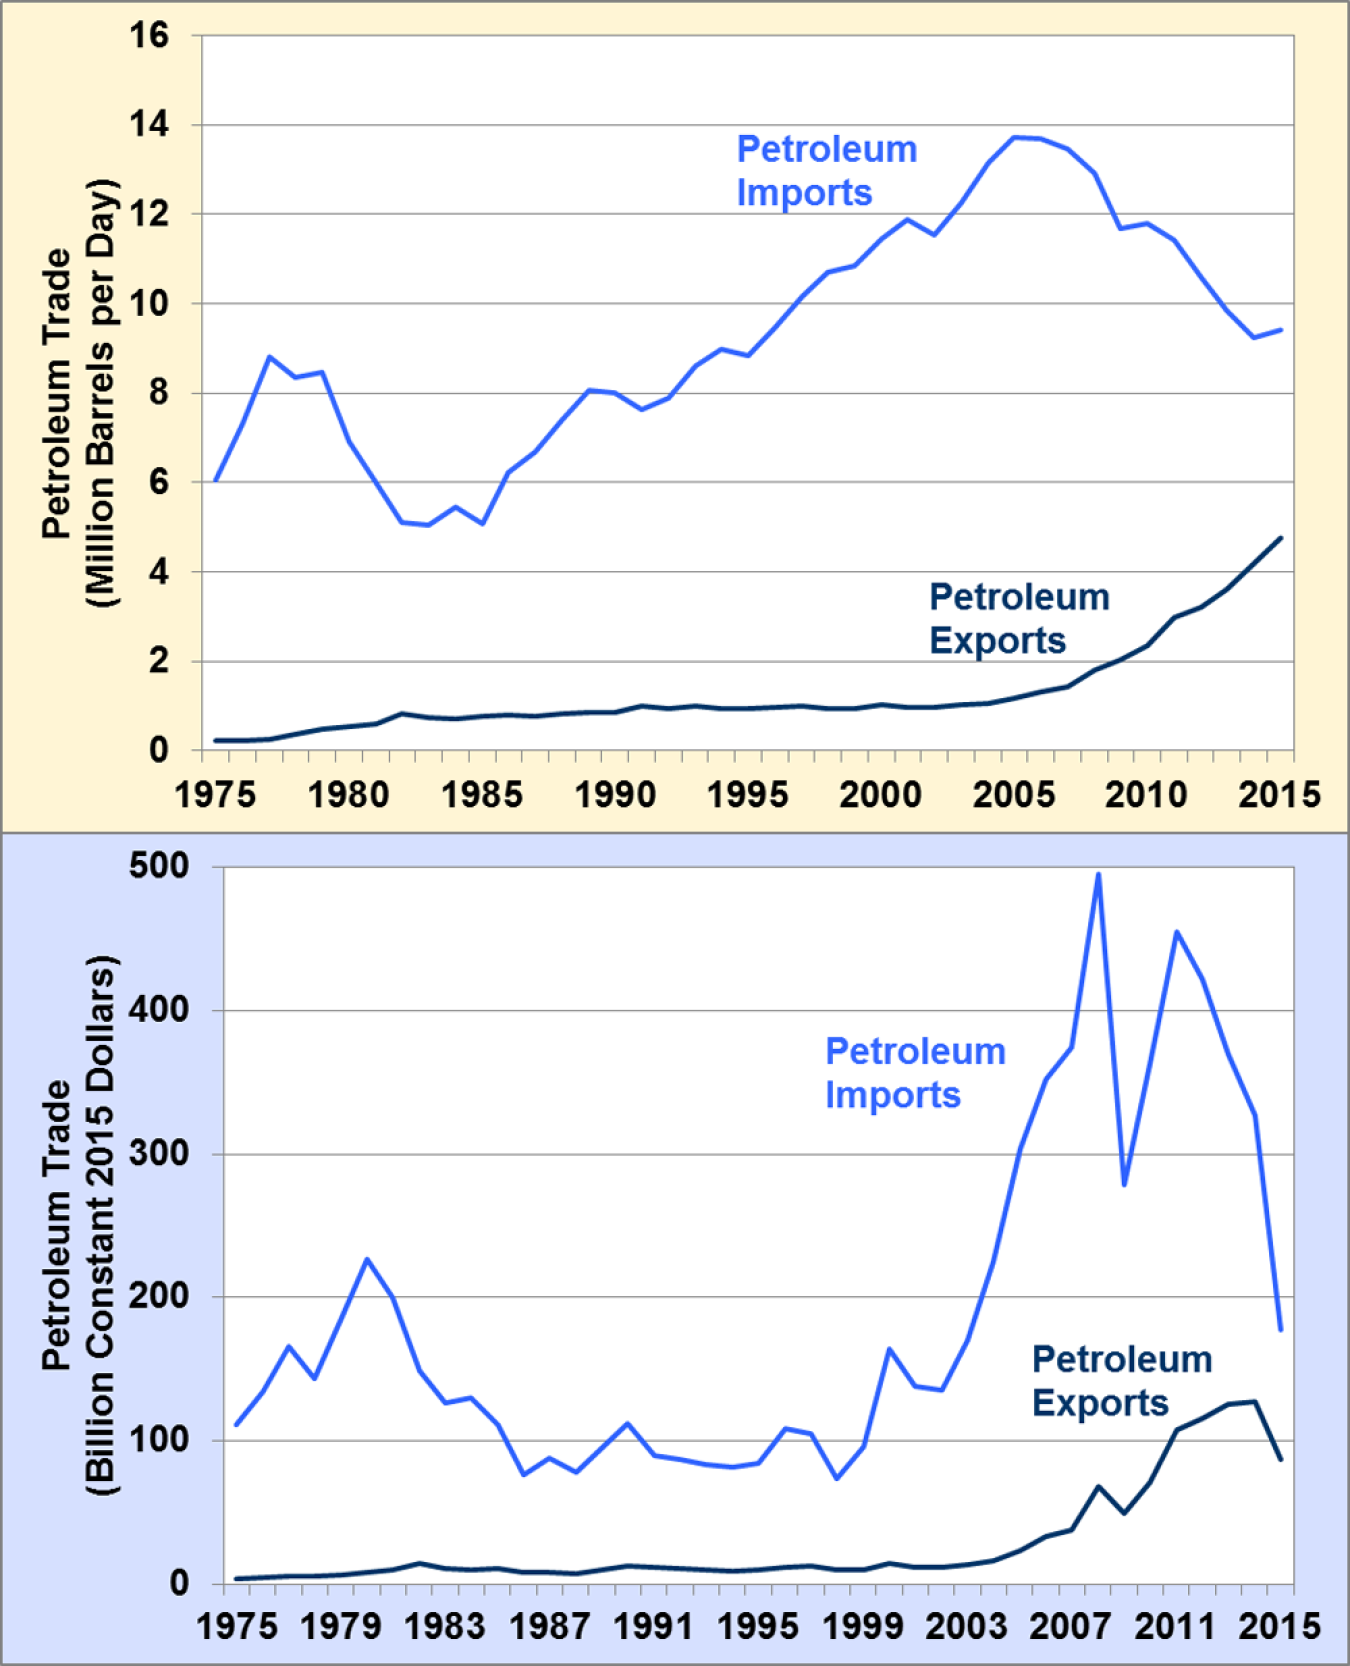
Note: For these data, petroleum includes both crude oil and petroleum products.
Supporting Information
| Year | Petroleum Exports | Petroleum Imports | Petroleum Exports | Petroleum Imports |
|---|---|---|---|---|
| (Million Barrels per Day) | (Billion Constant 2015 Dollars) | |||
| 1975 | 0.2 | 6.1 | 4.0 | 111.0 |
| 1976 | 0.2 | 7.3 | 4.2 | 134.2 |
| 1977 | 0.2 | 8.8 | 5.0 | 165.7 |
| 1978 | 0.4 | 8.4 | 5.7 | 143.7 |
| 1979 | 0.5 | 8.5 | 6.2 | 185.2 |
| 1980 | 0.5 | 6.9 | 8.2 | 226.2 |
| 1981 | 0.6 | 6.0 | 9.6 | 199.9 |
| 1982 | 0.8 | 5.1 | 14.6 | 148.5 |
| 1983 | 0.7 | 5.1 | 10.8 | 126.6 |
| 1984 | 0.7 | 5.4 | 10.2 | 129.9 |
| 1985 | 0.8 | 5.1 | 10.4 | 111.2 |
| 1986 | 0.8 | 6.2 | 7.9 | 76.0 |
| 1987 | 0.8 | 6.7 | 8.2 | 88.2 |
| 1988 | 0.8 | 7.4 | 7.4 | 77.7 |
| 1989 | 0.9 | 8.1 | 9.6 | 95.0 |
| 1990 | 0.9 | 8.0 | 12.5 | 111.7 |
| 1991 | 1.0 | 7.6 | 12.1 | 89.4 |
| 1992 | 0.9 | 7.9 | 10.8 | 86.5 |
| 1993 | 1.0 | 8.6 | 10.2 | 83.7 |
| 1994 | 0.9 | 9.0 | 9.1 | 81.3 |
| 1995 | 0.9 | 8.8 | 9.8 | 84.6 |
| 1996 | 1.0 | 9.5 | 12.1 | 108.8 |
| 1997 | 1.0 | 10.2 | 12.7 | 105.1 |
| 1998 | 0.9 | 10.7 | 9.6 | 73.1 |
| 1999 | 0.9 | 10.9 | 10.1 | 95.6 |
| 2000 | 1.0 | 11.5 | 14.0 | 164.1 |
| 2001 | 1.0 | 11.9 | 11.9 | 137.5 |
| 2002 | 1.0 | 11.5 | 11.3 | 135.3 |
| 2003 | 1.0 | 12.3 | 13.2 | 170.6 |
| 2004 | 1.0 | 13.1 | 16.5 | 224.9 |
| 2005 | 1.2 | 13.7 | 23.2 | 303.5 |
| 2006 | 1.3 | 13.7 | 33.1 | 352.4 |
| 2007 | 1.4 | 13.5 | 38.1 | 374.5 |
| 2008 | 1.8 | 12.9 | 67.9 | 495.2 |
| 2009 | 2.0 | 11.7 | 49.2 | 278.2 |
| 2010 | 2.4 | 11.8 | 70.4 | 362.5 |
| 2011 | 3.0 | 11.4 | 107.7 | 455.1 |
| 2012 | 3.2 | 10.6 | 115.6 | 421.7 |
| 2013 | 3.6 | 9.9 | 125.4 | 369.5 |
| 2014 | 4.2 | 9.2 | 127.1 | 327.1 |
| 2015 | 4.8 | 9.4 | 87.3 | 177.4 |
Sources: U.S. Energy Information Administration, March 2016 Monthly Energy Review, Tables 1.5 and 3.3a. | ||||