
SUBSCRIBE to the Fact of the Week
The relationship between gallons used over a given distance and miles per gallon (mpg) is not linear. Trading a low-mpg car or truck for one with just slightly better mpg will save more fuel than trading a high-mpg car or truck for one that is even higher. An improvement in fuel economy by 5 mpg does not translate to a constant fuel savings amount. For example, trading a truck that gets 10 mpg for a new one that gets 15 mpg will save 33 gallons of fuel for every 1,000 miles driven. In contrast, trading a 30-mpg car for a new car that gets 35 mpg will save 5 gallons of fuel for every 1,000 miles driven.
Fuel Use versus Fuel Economy
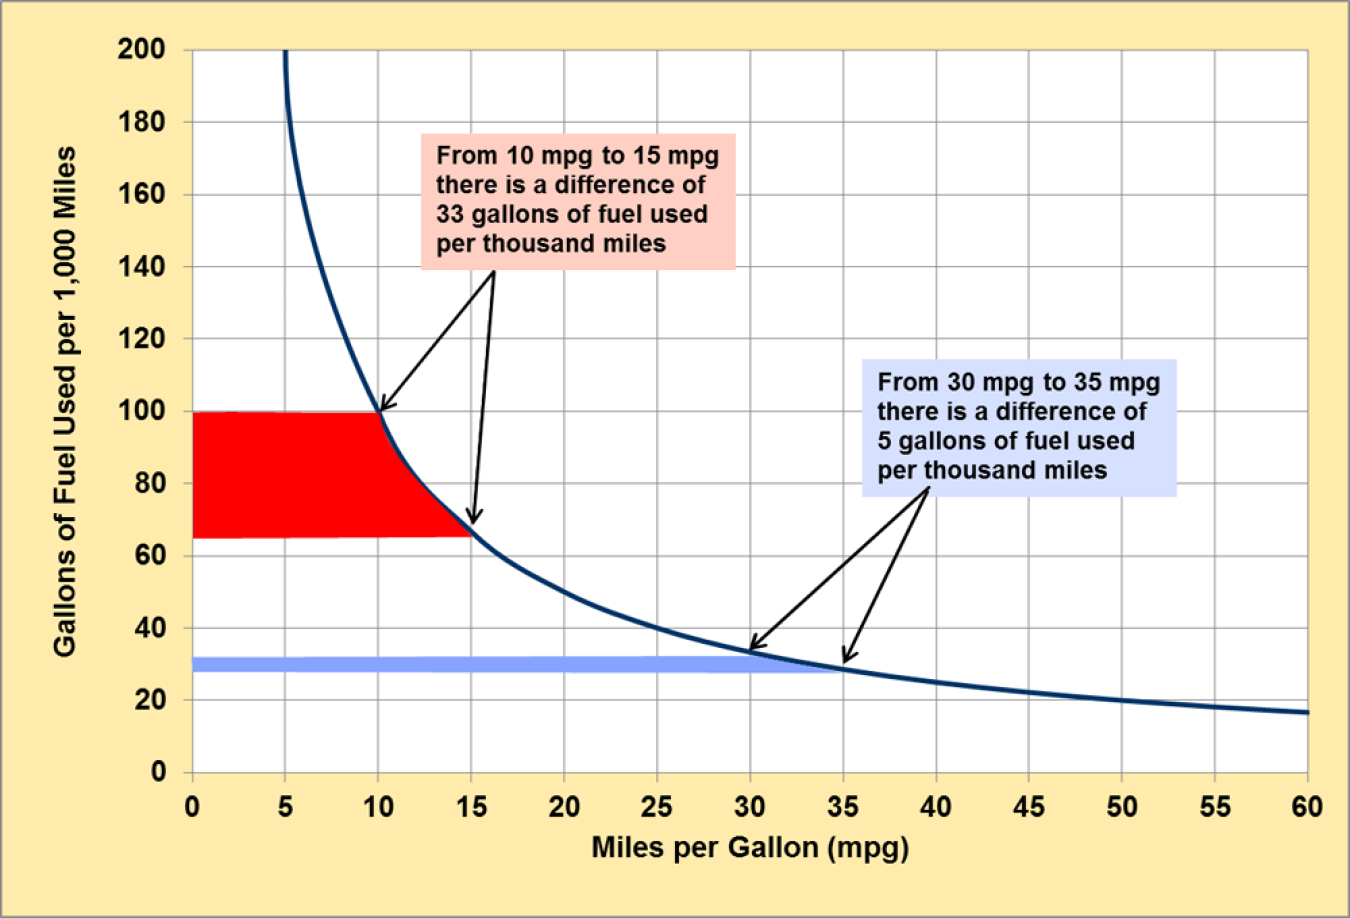
Note: Each category on the horizontal axis shows a five-mile per gallon improvement in fuel economy.
Supporting Information
| Fuel Economy (Miles per Gallon) | Gallons Per 1,000 Miles | If you have a car with this fuel economy | And you trade it for a car with this fuel economy | You save this many gallons for every 1,000 miles you drive |
|---|---|---|---|---|
| 5 | 200.0 | 5 | 10 | 100.0 |
| 10 | 100.0 | 10 | 15 | 33.3 |
| 15 | 66.7 | 15 | 20 | 16.7 |
| 20 | 50.0 | 20 | 25 | 10.0 |
| 25 | 40.0 | 25 | 30 | 6.7 |
| 30 | 33.3 | 30 | 35 | 4.8 |
| 35 | 28.6 | 35 | 40 | 3.6 |
| 40 | 25.0 | 40 | 45 | 2.8 |
| 45 | 22.2 | 45 | 50 | 2.2 |
| 50 | 20.0 | 50 | 55 | 1.8 |
| 55 | 18.2 | 55 | 60 | 1.5 |
| 60 | 16.7 | |||
Source: Oak Ridge National Laboratory, 2015 Vehicle Technologies Market Report, ORNL/TM-2016/124, April 2016, Figure 4. | ||||