
SUBSCRIBE to the Fact of the Week
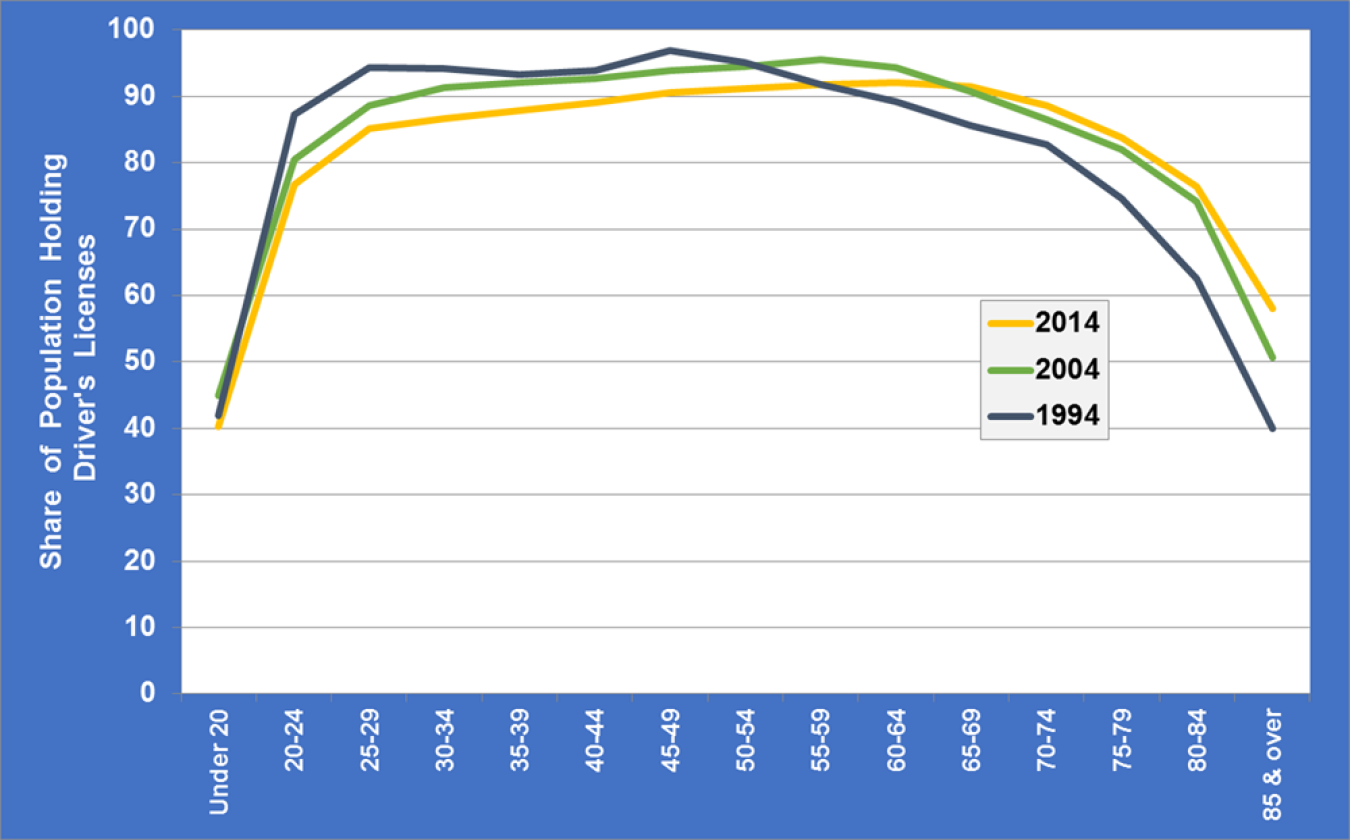
Examining the share of population holding driver’s licenses in 1994, 2004, and 2014, all of the age groups under 50 years old had lower shares for 2014 than in 2004, and nearly all of the 2004 shares were lower than in 1994. That trend is reversed for the older population where the share of those holding driver’s licenses in categories over 65 years of age increased for each of the ten-year periods. Among those 85 and older, 40% had driver’s licenses in 1994; in 2004, that same age group climbed to 50% and was nearly 60% in 2014. In 1994, 87% of 20-24 year olds had licenses, but in 2014, only 77% of 20-24 year olds had licenses.
Share of Population Holding Driver's Licenses by Age Group, 1994, 2004, and 2014
Supporting Information
| Year | |||
|---|---|---|---|
| Age | 1994 | 2004 | 2014 |
| Under 20 | 41.9 | 45.0 | 40.3 |
| 20-24 | 87.2 | 80.5 | 76.7 |
| 25-29 | 94.4 | 88.7 | 85.1 |
| 30-34 | 94.2 | 91.3 | 86.6 |
| 35-39 | 93.2 | 92.1 | 87.9 |
| 40-44 | 93.8 | 92.7 | 89.1 |
| 45-49 | 96.9 | 93.8 | 90.5 |
| 50-54 | 95.1 | 94.5 | 91.2 |
| 55-59 | 91.7 | 95.5 | 91.8 |
| 60-64 | 89.1 | 94.3 | 92.1 |
| 65-69 | 85.5 | 90.7 | 91.4 |
| 70-74 | 82.7 | 86.5 | 88.7 |
| 75-79 | 74.7 | 82.0 | 83.7 |
| 80-84 | 62.5 | 74.1 | 76.5 |
| 85 & over | 40.0 | 50.6 | 58.1 |
Source: | |||