
SUBSCRIBE to the Fact of the Week
In the United States, the U.S. Department of Transportation classifies 3.9 million miles of roadway as rural and 1.2 million miles of roadway as urban. Each state has a different travel pattern affecting the proportion of vehicle miles traveled (VMT) on rural versus urban roads. Massachusetts, New Jersey, Rhode Island, Connecticut, California, Hawaii, Florida, and Maryland are states with more than 80% urban VMT shown in darker shades of blue. North Dakota has the highest percentage of rural VMT of all states (shown in green). Other states, such as Wisconsin, Arkansas, and Alaska are close to an equal number of rural versus urban VMT.
Rural versus Urban VMT by State, 2013*
(Total U.S. VMT = 3 Trillion Miles)
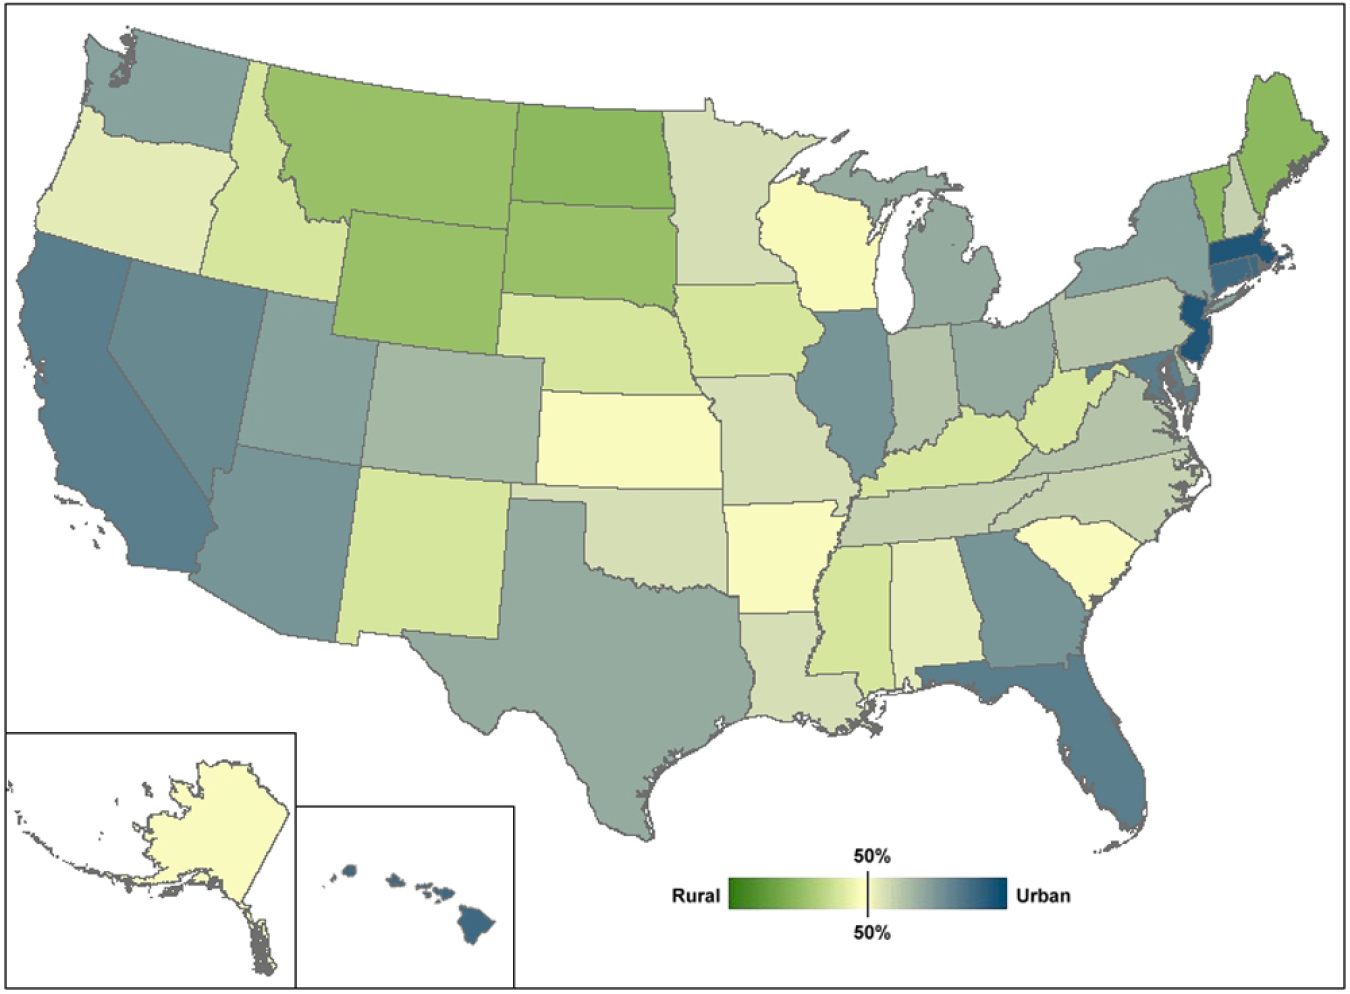
* The most recent data available are 2013.
Supporting Information
| State | Rural VMT Share | Urban VMT Share | Million VMT |
|---|---|---|---|
| Alabama | 46.6% | 53.4% | 65,046 |
| Alaska | 48.0% | 52.0% | 4,848 |
| Arizona | 23.5% | 76.5% | 60,586 |
| Arkansas | 48.0% | 52.0% | 33,493 |
| California | 15.7% | 84.3% | 329,534 |
| Colorado | 31.6% | 68.4% | 46,968 |
| Connecticut | 12.3% | 87.7% | 30,941 |
| Delaware | 32.8% | 67.2% | 9,308 |
| Dist. of Columbia | 0.0% | 100.0% | 3,527 |
| Florida | 18.0% | 82.0% | 192,702 |
| Georgia | 23.4% | 76.6% | 109,355 |
| Hawaii | 17.8% | 82.2% | 10,099 |
| Idaho | 58.1% | 41.9% | 15,980 |
| Illinois | 24.1% | 75.9% | 105,297 |
| Indiana | 37.2% | 62.8% | 78,311 |
| Iowa | 57.5% | 42.5% | 31,641 |
| Kansas | 47.9% | 52.1% | 30,208 |
| Kentucky | 57.8% | 42.2% | 46,996 |
| Louisiana | 41.4% | 58.6% | 47,758 |
| Maine | 72.4% | 27.6% | 14,129 |
| Maryland | 18.6% | 81.4% | 56,688 |
| Massachusetts | 4.6% | 95.4% | 56,311 |
| Michigan | 29.5% | 70.5% | 95,132 |
| Minnesota | 40.9% | 59.1% | 56,974 |
| Mississippi | 56.9% | 43.1% | 38,758 |
| Missouri | 41.0% | 59.0% | 69,458 |
| Montana | 69.3% | 30.7% | 12,033 |
| Nebraska | 58.1% | 41.9% | 19,322 |
| Nevada | 20.3% | 79.7% | 24,649 |
| New Hampshire | 39.3% | 60.7% | 12,903 |
| New Jersey | 6.1% | 93.9% | 74,530 |
| New Mexico | 57.3% | 42.7% | 25,086 |
| New York | 25.1% | 74.9% | 129,737 |
| North Carolina | 38.6% | 61.4% | 105,213 |
| North Dakota | 74.4% | 25.6% | 10,100 |
| Ohio | 29.5% | 70.5% | 112,767 |
| Oklahoma | 42.9% | 57.1% | 47,999 |
| Oregon | 44.5% | 55.5% | 33,706 |
| Pennsylvania | 35.8% | 64.2% | 98,628 |
| Rhode Island | 11.6% | 88.4% | 7,775 |
| South Carolina | 47.8% | 52.2% | 48,986 |
| South Dakota | 70.4% | 29.6% | 9,122 |
| Tennessee | 39.3% | 60.7% | 71,067 |
| Texas | 31.0% | 69.0% | 244,525 |
| Utah | 26.8% | 73.2% | 27,005 |
| Vermont | 73.9% | 26.1% | 7,116 |
| Virginia | 37.3% | 62.7% | 80,767 |
| Washington | 27.3% | 72.7% | 57,211 |
| West Virginia | 58.3% | 41.7% | 19,232 |
| Wisconsin | 51.7% | 48.3% | 59,486 |
| Wyoming | 69.2% | 30.8% | 9,309 |
| Total | 31.5% | 68.5% | 2,988,322 |
Source: U.S. Department of Transportation, Federal Highway Administration, Highway Statistics 2013, Washington, DC, 2014, Tables VM-2. Table HM-12 used for miles of rural and urban roadway cited in the text. | |||