
SUBSCRIBE to the Fact of the Week
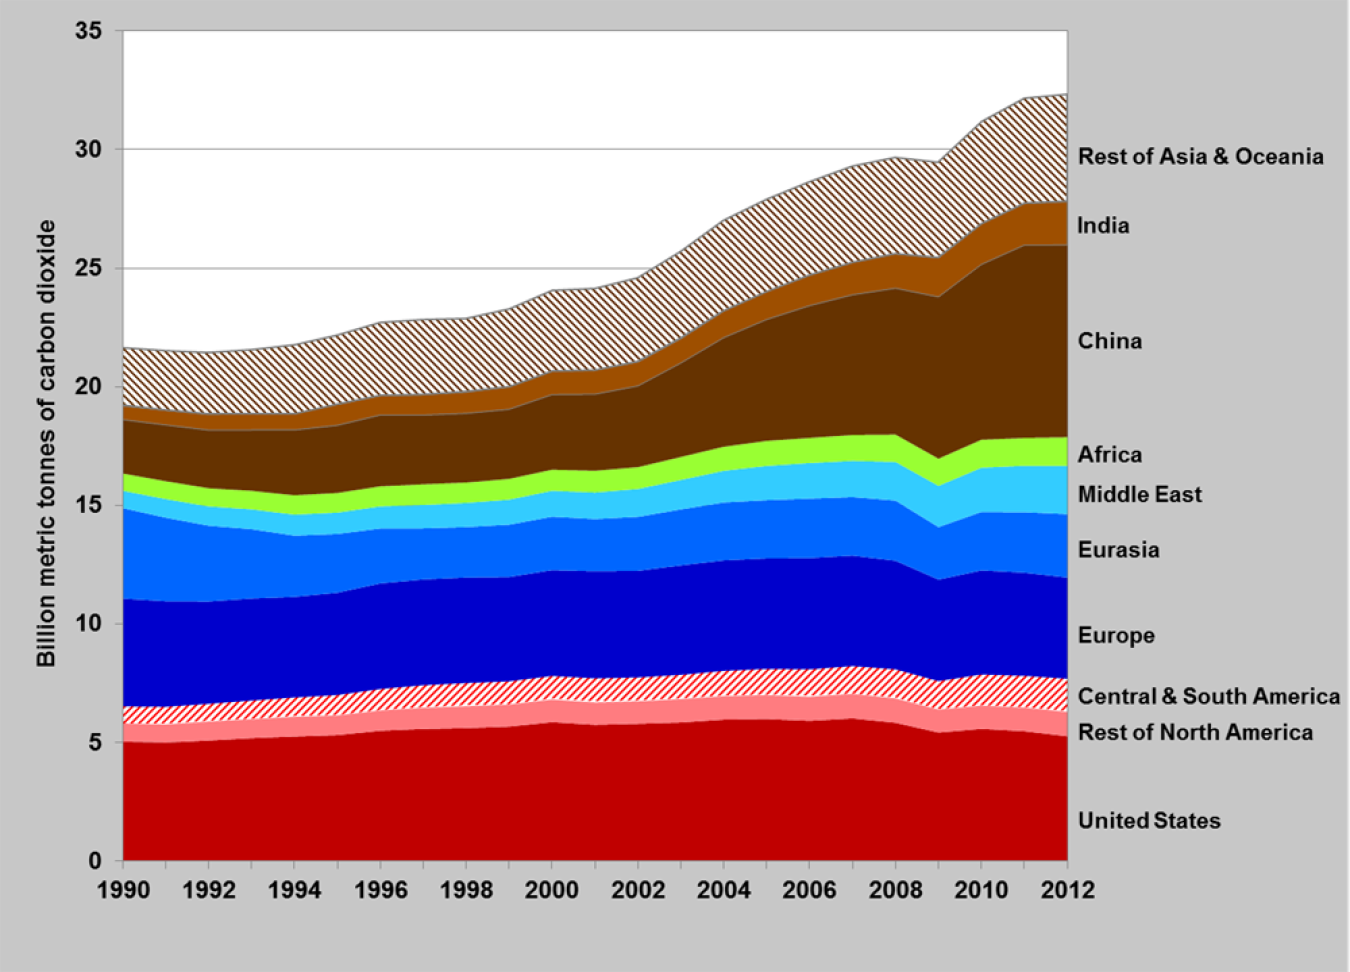
Since 1990, China shows the greatest increase of carbon dioxide (CO2) emissions. The Americas, Europe and Eurasia have about the same CO2 emissions in 2012 as in 1990. The small downturn in 2009 emissions coincides with the Great Recession that was not only felt in the United States, but worldwide.
World Carbon Dioxide Emissions, 1990–2012
Supporting Information
| Year | United States | Rest of North America | Central & South America | Europe | Eurasia | Middle East | Africa | India | China | Rest of Asia & Oceania |
|---|---|---|---|---|---|---|---|---|---|---|
| 1990 | 5,041 | 774 | 716 | 4,543 | 3,818 | 730 | 727 | 579 | 2,269 | 2,414 |
| 1991 | 4,998 | 776 | 738 | 4,452 | 3,521 | 785 | 751 | 621 | 2,369 | 2,498 |
| 1992 | 5,093 | 800 | 744 | 4,316 | 3,196 | 815 | 764 | 660 | 2,449 | 2,568 |
| 1993 | 5,188 | 803 | 784 | 4,300 | 2,923 | 840 | 776 | 691 | 2,565 | 2,686 |
| 1994 | 5,261 | 833 | 812 | 4,242 | 2,581 | 885 | 813 | 741 | 2,754 | 2,815 |
| 1995 | 5,319 | 831 | 858 | 4,313 | 2,478 | 901 | 826 | 880 | 2,852 | 2,909 |
| 1996 | 5,505 | 854 | 903 | 4,451 | 2,315 | 935 | 843 | 814 | 3,006 | 3,054 |
| 1997 | 5,577 | 895 | 949 | 4,461 | 2,152 | 989 | 868 | 856 | 2,918 | 3,167 |
| 1998 | 5,617 | 922 | 975 | 4,450 | 2,125 | 1,019 | 856 | 893 | 2,916 | 3,086 |
| 1999 | 5,678 | 931 | 978 | 4,396 | 2,207 | 1,057 | 873 | 951 | 2,933 | 3,268 |
| 2000 | 5,864 | 957 | 992 | 4,459 | 2,253 | 1,095 | 887 | 991 | 3,165 | 3,377 |
| 2001 | 5,755 | 943 | 1,014 | 4,513 | 2,204 | 1,120 | 916 | 1,016 | 3,227 | 3,426 |
| 2002 | 5,799 | 948 | 1,005 | 4,493 | 2,275 | 1,177 | 918 | 1,008 | 3,422 | 3,535 |
| 2003 | 5,853 | 986 | 1,021 | 4,613 | 2,361 | 1,244 | 968 | 1,022 | 3,960 | 3,660 |
| 2004 | 5,974 | 991 | 1,062 | 4,658 | 2,440 | 1,335 | 1,016 | 1,121 | 4,597 | 3,775 |
| 2005 | 5,999 | 1,009 | 1,103 | 4,659 | 2,451 | 1,448 | 1,053 | 1,181 | 5,116 | 3,860 |
| 2006 | 5,924 | 1,017 | 1,149 | 4,695 | 2,501 | 1,503 | 1,059 | 1,281 | 5,575 | 3,917 |
| 2007 | 6,024 | 1,035 | 1,169 | 4,657 | 2,468 | 1,531 | 1,087 | 1,366 | 5,908 | 4,021 |
| 2008 | 5,841 | 1,029 | 1,220 | 4,581 | 2,535 | 1,631 | 1,152 | 1,449 | 6,167 | 4,041 |
| 2009 | 5,430 | 967 | 1,198 | 4,280 | 2,212 | 1,741 | 1,146 | 1,643 | 6,816 | 4,003 |
| 2010 | 5,580 | 984 | 1,311 | 4,387 | 2,466 | 1,863 | 1,180 | 1,715 | 7,389 | 4,280 |
| 2011 | 5,483 | 999 | 1,335 | 4,348 | 2,551 | 1,959 | 1,169 | 1,753 | 8,127 | 4,431 |
| 2012 | 5,270 | 1,028 | 1,400 | 4,263 | 2,672 | 2,036 | 1,206 | 1,831 | 8,106 | 4,498 |
Source: U.S. Department of Energy, Energy Information Administration, International Energy Statistics, Total Carbon Dioxide Emissions from the Consumption of Energy. Accessed July 2015. | ||||||||||